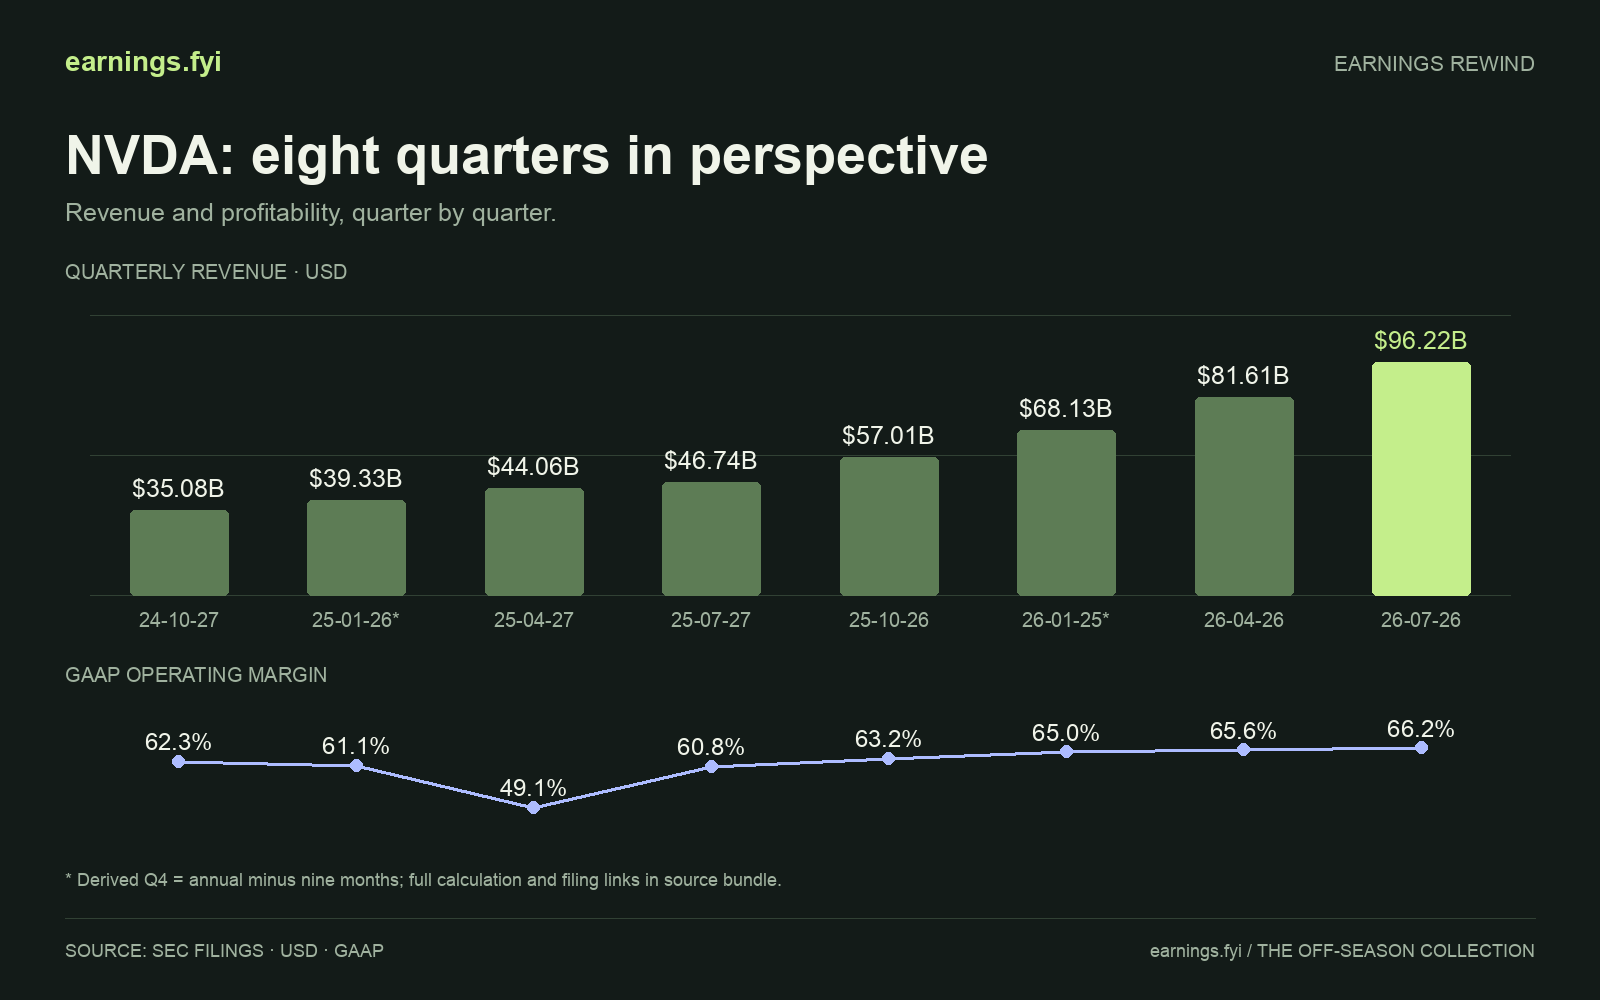
LATEST QUARTER REVENUE$96.22B
REVENUE CHANGE · FULL PERIOD174.3%
GAAP OPERATING MARGIN66.2%
Read the chart in context.
USD · GAAP · Latest available filing comparisons. * marks Q4 derived as FY minus nine months.
Chart prepared Oct 3, 2026. Reporting periods are shown on the chart; these are financial statement figures, not live market data.
Original SEC filings & calculation inputs
Reported inputs are listed below. Derived quarters include the annual and nine-month values used in the calculation.
| Reported metric | USD | Period end | Filed |
|---|---|---|---|
| Revenues | 35,082,000,000 | 2024-10-27 | 2025-11-19 |
| OperatingIncomeLoss | 21,869,000,000 | 2024-10-27 | 2025-11-19 |
| GrossProfit | 26,156,000,000 | 2024-10-27 | 2025-11-19 |
| Revenues | 18,120,000,000 | 2023-10-29 | 2024-11-20 |
| Revenues | 130,497,000,000 | 2025-01-26 | 2025-02-26 |
| Revenues | 91,166,000,000 | 2024-10-27 | 2024-11-20 |
| OperatingIncomeLoss | 81,453,000,000 | 2025-01-26 | 2025-02-26 |
| OperatingIncomeLoss | 57,419,000,000 | 2024-10-27 | 2024-11-20 |
| GrossProfit | 97,858,000,000 | 2025-01-26 | 2025-02-26 |
| GrossProfit | 69,135,000,000 | 2024-10-27 | 2024-11-20 |
| Revenues | 60,922,000,000 | 2024-01-28 | 2024-02-21 |
| Revenues | 38,819,000,000 | 2023-10-29 | 2023-11-21 |
| Revenues | 44,062,000,000 | 2025-04-27 | 2026-05-20 |
| OperatingIncomeLoss | 21,638,000,000 | 2025-04-27 | 2026-05-20 |
| GrossProfit | 26,668,000,000 | 2025-04-27 | 2026-05-20 |
| Revenues | 26,044,000,000 | 2024-04-28 | 2025-05-28 |
| Revenues | 46,743,000,000 | 2025-07-27 | 2026-08-26 |
| OperatingIncomeLoss | 28,440,000,000 | 2025-07-27 | 2026-08-26 |
| GrossProfit | 33,853,000,000 | 2025-07-27 | 2026-08-26 |
| Revenues | 30,040,000,000 | 2024-07-28 | 2025-08-27 |
| Revenues | 57,006,000,000 | 2025-10-26 | 2025-11-19 |
| OperatingIncomeLoss | 36,010,000,000 | 2025-10-26 | 2025-11-19 |
| GrossProfit | 41,849,000,000 | 2025-10-26 | 2025-11-19 |
| Revenues | 215,938,000,000 | 2026-01-25 | 2026-02-25 |
| Revenues | 147,811,000,000 | 2025-10-26 | 2025-11-19 |
| OperatingIncomeLoss | 130,387,000,000 | 2026-01-25 | 2026-02-25 |
| OperatingIncomeLoss | 86,088,000,000 | 2025-10-26 | 2025-11-19 |
| GrossProfit | 153,463,000,000 | 2026-01-25 | 2026-02-25 |
| GrossProfit | 102,370,000,000 | 2025-10-26 | 2025-11-19 |
| Revenues | 81,615,000,000 | 2026-04-26 | 2026-05-20 |
| OperatingIncomeLoss | 53,536,000,000 | 2026-04-26 | 2026-05-20 |
| GrossProfit | 61,157,000,000 | 2026-04-26 | 2026-05-20 |
| Revenues | 96,221,000,000 | 2026-07-26 | 2026-08-26 |
| OperatingIncomeLoss | 63,734,000,000 | 2026-07-26 | 2026-08-26 |
| GrossProfit | 72,142,000,000 | 2026-07-26 | 2026-08-26 |